1.1. Proximal crop and soil sensing
Participants: A. Escolà, J.R. Rosell-Polo, J.A. Martínez-Casasnovas, J. Llorens, E. Gregorio, J. Gené, R. Sanz, B. Lavaquiol.
In Precision Agriculture, the most widely used convention is that sensors embedded in terrestrial platforms are considered to make near or terrestrial detection while those that have no contact with the ground (embedded in drones, planes or satellites) are considered which do remote sensing. With this premise, the GRAP works with different types of sensors to characterize crops and their environment and georeference the data obtained.
1.1.1. 3D characterization of vegetation
In fruit growing, information on the geometric and structural characteristics of plantations has innumerable applications. Knowing and taking into account the external dimensions of the leaf canopy (height, width and volume), as well as the internal characteristics and structure of the crown (porosity, space occupancy and leaf area index) can improve the farm management. Specifically, operations such as the application of plant protection products, irrigation, fertilization and pruning and crop formation techniques can be carried out more efficiently when the variability of vegetation is taken into account. The knowledge of the geometrical-structural characteristics of the plantations allows to optimize the use of resources and, with this, to reduce the environmental and economic impact of his application.
GRAP specializes in the use of LiDAR (Light Detection and Ranging) sensors for the creation of three-dimensional point clouds from which useful information on vegetation can be obtained for agronomic management decision making. In addition, GRAP also has RGB-D cameras and uses photogrammetry techniques to characterize the leaf canopy and fruits.
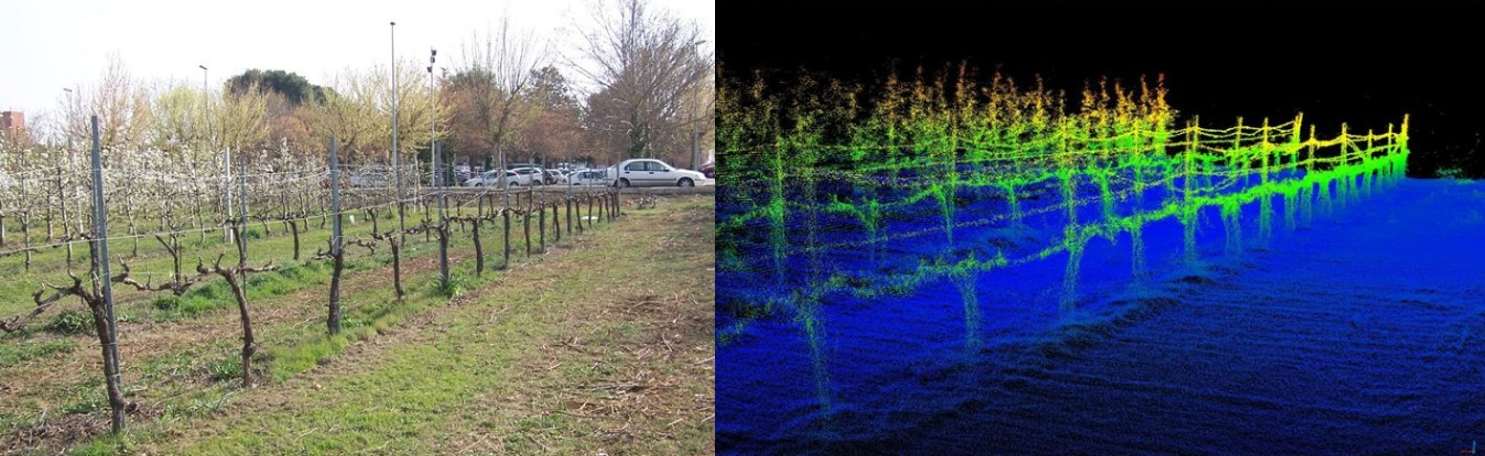
Figure 1. Example of an ETSEA experimental plot scanned with a mobile terrestrial scanner based on LiDAR technology (youtu.be/7Gj0TjafIMY).
The GRAP currently has a portable terrestrial laser scanner and an electric all-terrain vehicle that allow fruit orchards, vineyards and also extensive crops to scanned for research purposes. However, in order to make the 3D model of the cropof direct use to the farmer or technician, three-dimensional point clouds must be processed to extract information and display it in a useful format, such as digital top-down mapping. These maps can show the height of the crop, the width of the crown, its volume, its porosity or even the growth between two dates at any point in the plot and see if its distribution is uniform or variable within the plot. With these maps and all the auxiliary information available to the farmer or the advisory company, it will be possible to make better documented management decisions.
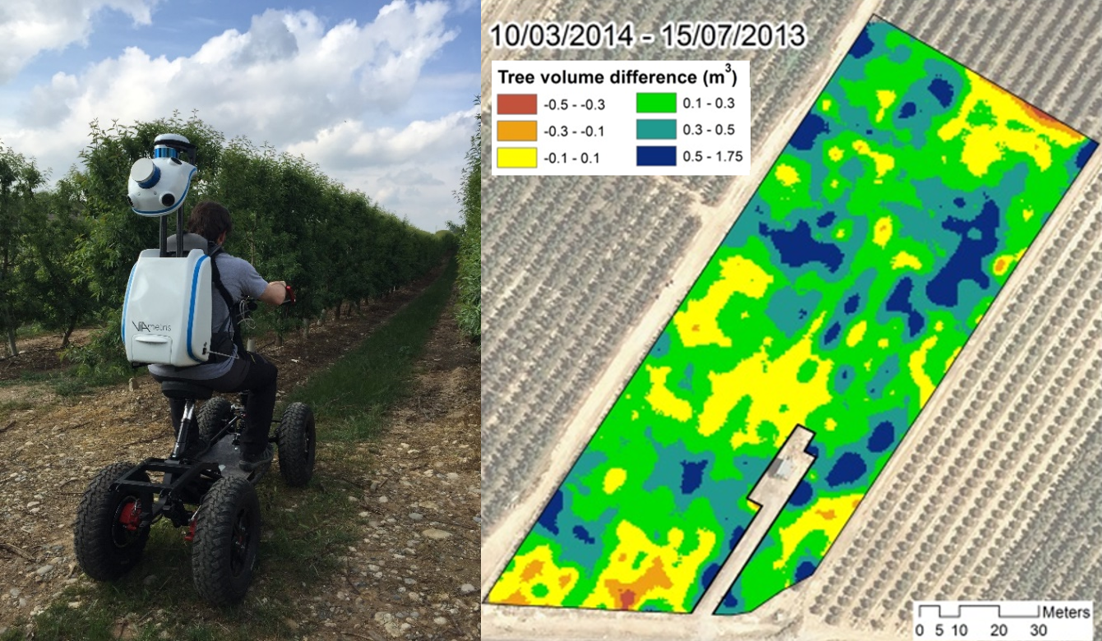
Figure 2. Viametris bMS3D portable terrestrial laser scanner based on LiDAR sensors (left) and vegetation growth map between two scan dates (right). Source: Precision Agriculture 18(1), 111-132. DOI: 10.1007/s11119-016-9474-5.
Among the applications of crop 3D data in agronomic management are the following:
- Detection and quantification of crop variability on the plot.
- Detection and location of problems.
- Top pruning after winter pruning or green pruning.
- Dose adjustment of agricultural resources such as plant protection products, fertilizers or irrigation.
- Location of areas with a potential risk of pest or disease infection.
- Fruit detection and harvest estimation.
1.1.2. Soil characterization
An important source of crop variability is soil. If the soil, as a storehouse of water and nutrients, is not uniform, it is unlikely that the crop will grow evenly and produce uniform fruit. In addition, the soil is naturally spatially variable and this variability is not only on the surface, but also in depth.
One way to know the variability of the soil of an entire plot is to use sensors that make measurements on the go (on-the-go). The GRAP has a Veris 3100 sensor that measures the electrical conductivity of the ground at two depths: a) from 0 to 30 cm and b) from 0 to 90 cm. The system makes it possible to obtain georeferenced soil conductivity measurements, at a rate of one measurement per second, so that the sampling resolution will depend on the forward speedand the working width.
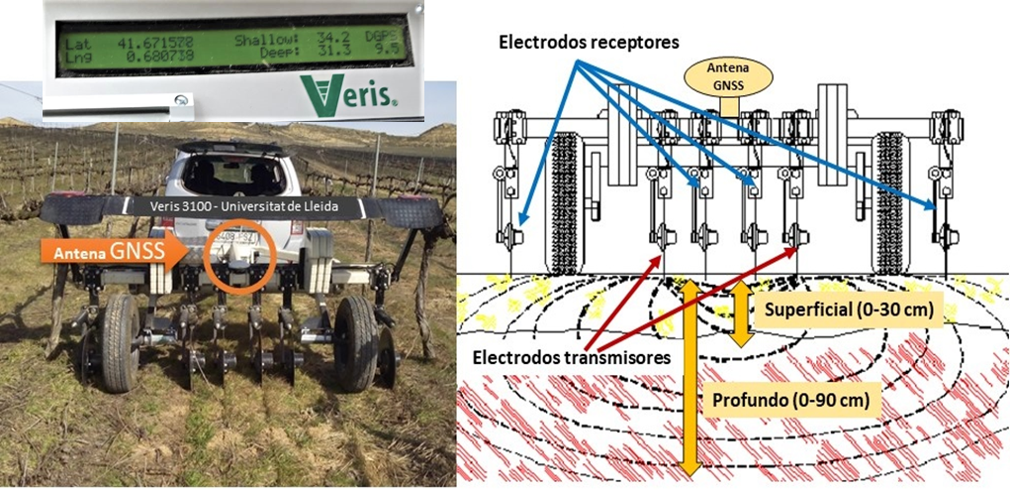
Figure 3. GRAP Veris 3100 sensor. Source: Veris Technologies, Inc. Salina, KC, USA.
Soil electrical conductivity is related to soil water content, organic matter content, texture, cation exchange capacity, depth, and salt content. Therefore, the values of electrical conductivity of the soil obtained do not allow to know the specific composition of the soil in each point of a plot but its uniformity. Thus, once the measurements of the electrical conductivity of the soil have been obtained and always with the necessary soil knowledge of the analysed area, it will be possible to create a map of the plot that will allow to establish potential areas of specific management.
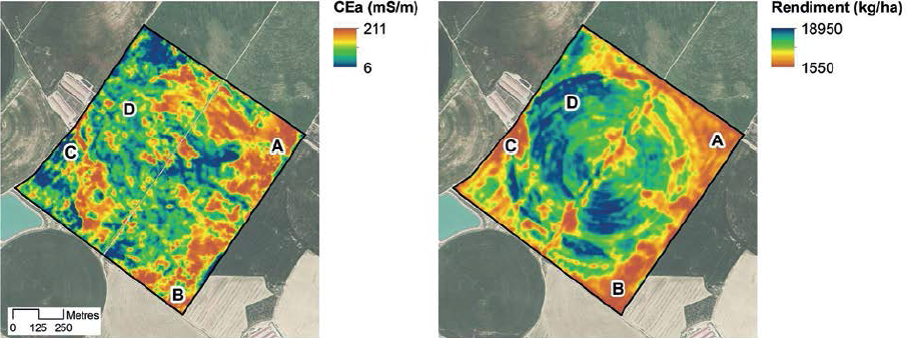
Figure 4. Comparison of the apparent electrical conductivity del suelo (CEa) of an agricultural plot devoted to extensive crops obtained from the data from the Veris 3100 sensor (left), and corn crop map from the same plot (right). The letters indicate different places for comparison that are discussed in the text. The colour palettes of the captions are inverted for easy comparison. Source: Own elaboration.
The applications of this type of ground sensor are as follows:
- Analysis of crop variability.
- Delimitation of potential areas of agronomic management of the crop for
- Variable irrigation.
- Variable fertilization.
- Variable rate seeding.
- Delimitation of irrigation sectors according to the water retention capacity of each area.
- Harvest prediction, along with crop vigour data.
1.1.3. Automated data acquisition systems
In this line of research, a platform is being developed to perform data acquisition tasks associated with precision agriculture, so that these are done in a more automated and autonomous way. The main function of this platform is to be able to include the appropriate perception systems to be able to take the necessary samples in the different observations that are made in the field. Data collection and sampling resolution will be tailored to the needs of each sensory system.
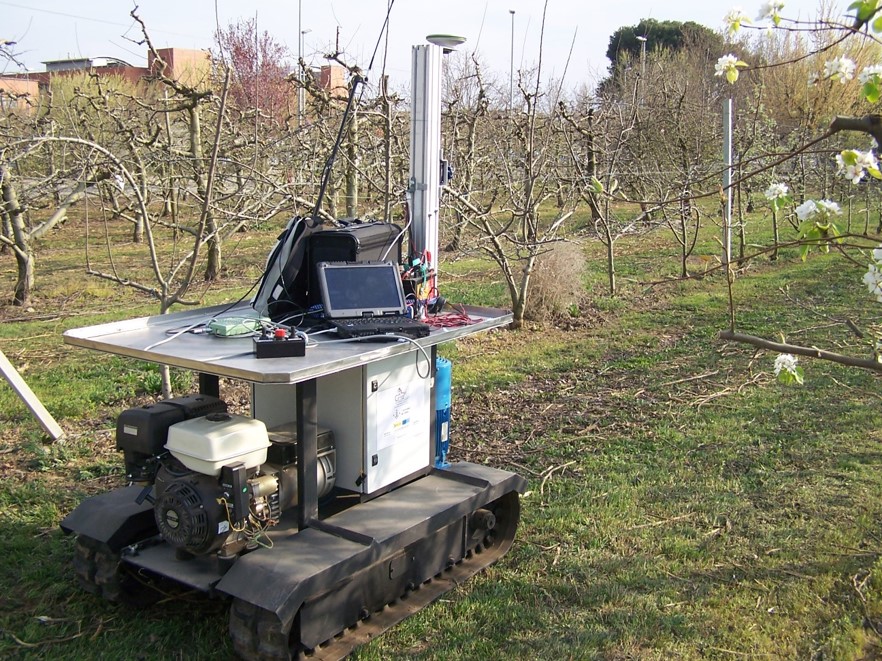
Figure 5. Image of the stand-alone platform designed in an ETSEA practice field.