1.3 Remote sensing applications
Participants: J.A. Martínez-Casasnovas, J. Arnó, A. Escolà, L. Sandonís, C. Román
1.3.1. Spectral characterization of vegetation
Remote sensing involves the acquisition of information on the earth's surface in the form of images using sensors or cameras, normally multispectral, on board satellites, aircraft, or unmanned aerial vehicles (UAVs, drones or Remotely Piloted Aircraft Systems – RPAS). These images are used in the analysis, mapping, monitoring of the state of the different types of covers (water, soil, vegetation, etc.), without coming into physical contact with them.
The application of remote sensing techniques is booming in agriculture, and more specifically in Precision Agriculture. Undoubtedly, the availability of free images, at a resolution of 10 m thanks to the satellites of the European Union's Sentinel-2 mission, and also the possibility of acquiring images of constellations such as PlanetScope (Planet Labs), with daily repeatability and a resolution of 3-4 m, is opening the range of applications in monitoring the development of crops for decision-making on their differential management (Figure 1). PlanetScope images are paid for by subscription, but, as with Sentinel-2, there are already intermediary companies that contract the subscription and later offer crop vigor monitoring services to farmers at reasonable prices of between 4-8 €/ha year.
Drones (Figure 1) are another type of platform, somewhat more versatile, which has undoubtedly popularized Precision Agriculture, since the level of detail capable of recording is associated with the idea of more precise images that can be do at any time.
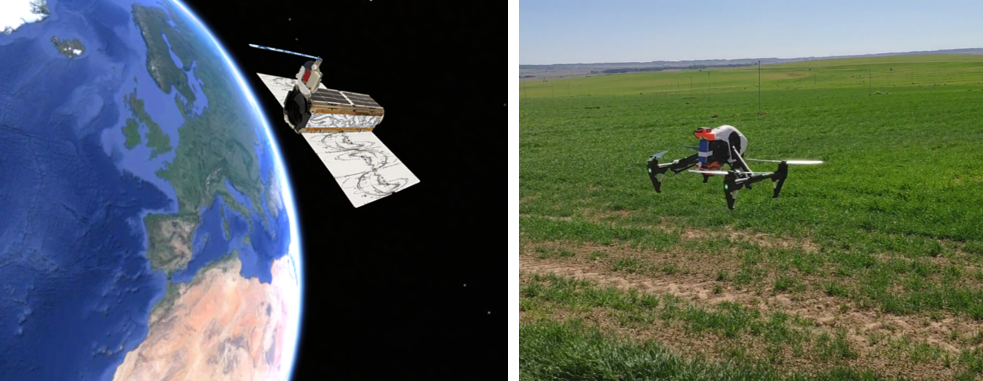
Figure 1. Left: Microsatellite or Dove from Planet Labs, with dimensions of 10x10x30cm. The constellation is made up of about 140 of these microsatellites that continuously capture images. Right: Quadcopter with multispectral camera initiating flight over a barley plot for mapping vegetative development.
What type of sensor is best for monitoring the vegetative development of crops for Precision Agriculture? Figure 2 can help answer this question. It compares a Sentinel-2A image, a PlanetScope image and an image acquired with a DJI Inspire1 drone and Parrot Sequoia camera. They are all from the same day, but have different resolutions: 10 m, 3 m and 0.06 m respectively. This means that a PlanetScope pixel has almost 11 times more detail than a Sentinel-2 pixel and, mind you, the drone image is 27890 times more detailed than Sentinel-2. Also, the drone image is 2500 times more detailed than PlanetScope. But is such resolution necessary? Surely not in the case of extensive crops, since the variable application machinery will not act with such precision and the type of crop does not require it. However, in other types of crops (vines, fruit trees, vegetables) and in smaller plots, drone images can be very useful, as it can distinguish the vegetation along the rows of the crop from bare soil or weeds. grasses from the area between rows. The 3m resolution of the PlanetScope image might be the best option, although pay-per-subscription to the proprietary company or fee-for-service to an intermediary company must be considered. Regarding the resolution of Sentinel-2, the general comparison with the other more detailed images also shows the same areas of variability in crop development. On the other hand, the images that can be acquired with multispectral cameras from small planes, with usual resolutions between 0.25 and 1 m, should not be neglected.
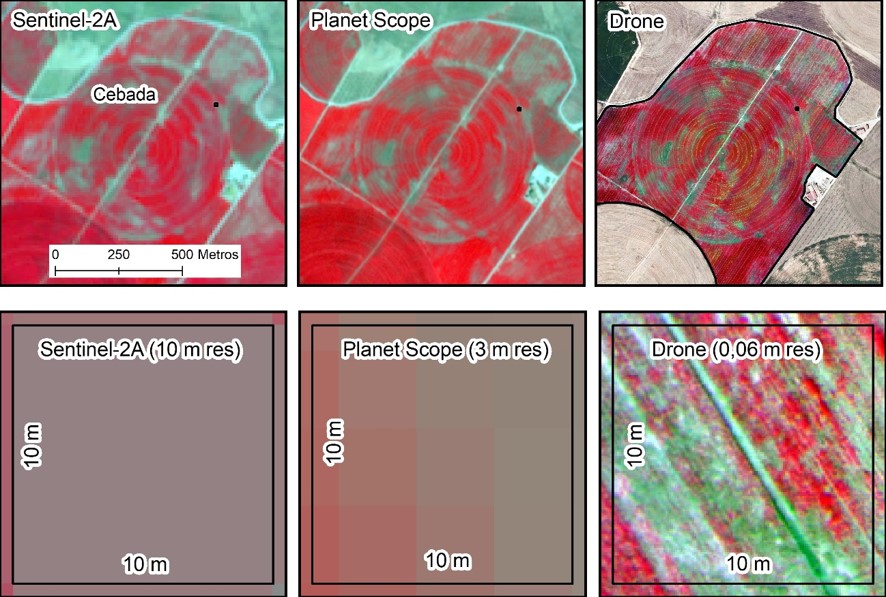
Figure 2. Comparison of Sentinel-2, Planet Scope, and drone false-color (RGB Near-Infrared-Red-Green) images at plot scale and 1-pixel scale at the same resolution as the Sentinel-2 images (10x10 m). In each case, the resolution of the type of image is indicated.
From multispectral images, the determination and monitoring of crops is done through the so-called vegetation or vigor indices. The best-known index is the Normalized Difference Vegetation Index (NDVI). This is a simple calculation using the amount of light reflected by plants in the red (R) and near infrared (NIR) wavelengths: NDVI = (NIR-R)/(NIR+R). The rationale for this formula can be seen in Figure 3. Healthy plants absorb light from the visible spectrum, primarily red light, to carry out photosynthesis and reflect much more near-infrared light. Therefore, the more vigor the plant has, the greater the absorption of red light (less reflection) and the greater the reflection of the near infrared. This, translated into the NDVI formula, means that a healthy plant will have a higher index value and a sick plant or one with some type of stress a lower value.
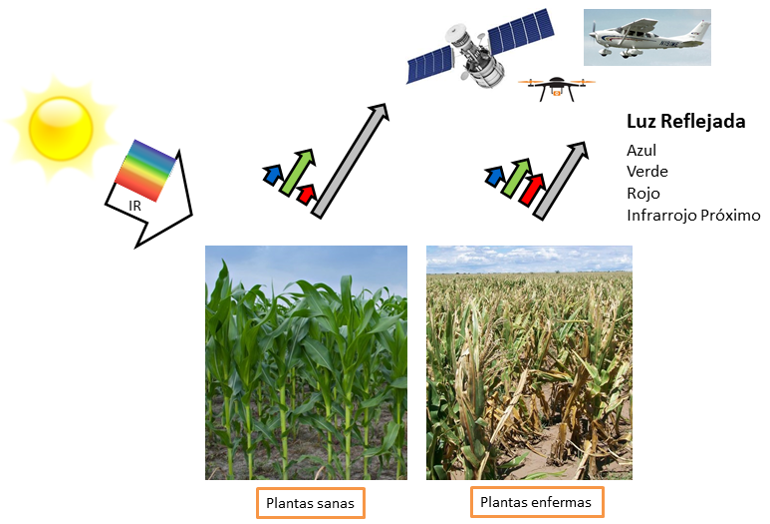
Figure 3. Basis for calculating vigor indices from multispectral images. Healthy plants (left) absorb light from the visible spectrum, mainly red light, to carry out photosynthesis and reflect more near-infrared light, therefore the difference between these two magnitudes will be greater and so will the vegetation index. Plants with some type of problem (right) will reflect more red light and less near-infrared light, resulting in a lower vegetation index value.
The NDVI is the best-known index and is the one that is usually used as a reference to estimate the vigor of plants from multispectral images, but there are many other combinations between bands that can provide similar information. Then, scientists have to establish relationships between these indices and the physiological characteristics of the plants or with the final yield of the crops.
Vegetation indices can be used for Precision Agriculture purposes in various ways and at different times of the crop cycle. Let us give some examples developed by the GRAP.
- Before the beginning of the campaign, and based on data from the previous or previous campaign, the vegetation indices can be used to define differential management zones within each plot, either for variable planting, base fertilization, application of organic or other amendments and, if possible, also differential irrigation. For such purposes, it may be better not to base the zoning on a single image from a specific date of the previous crop, but on the integration of images acquired throughout the entire crop cycle, accumulating the value of the vegetation index. This can better show the structural variability in the different parts of the plot, giving a more realistic view of the productive potential of the different areas of the field (Figure 4).
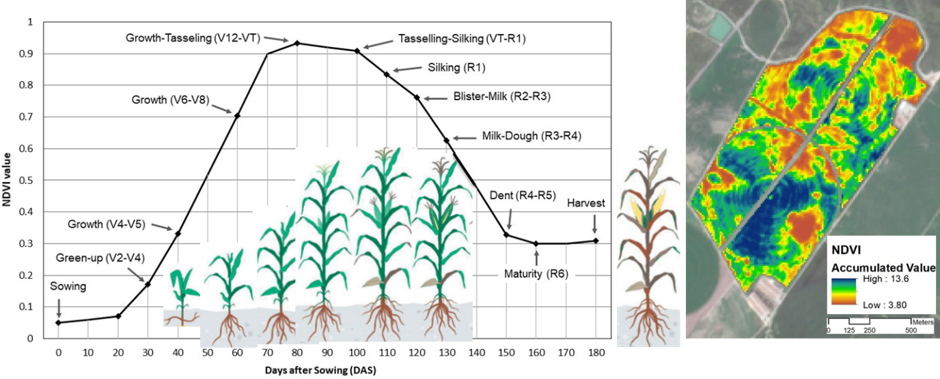
Figure 4. Example of NDVI throughout the maize crop cycle and image of the accumulated NDVI, which can better represent the relative productive potential of the plot than the NDVI of a given date. Source: Martínez-Casasnovas et al. (2018).
What happens if we do not have a whole series of images to estimate the productive potential of the plot? In some cases, farmers will only be able to pay for an image or will hire a service to find out the variability of crop vigor and make decisions based on the information derived from them. In these cases, and to direct the background fertilization and/or sowing of the subsequent crop, it would be best to acquire images of the previous crop from just before flowering (e.g., in maize or winter cereals, or at the beginning of maturation). or veraison (e.g., on vine) At other stages, crops (perhaps) have not reached their maximum vegetative expression or are already declining During flowering (e.g., maize), the color of the inflorescence can interfere with the greenness of the vegetation and will alter the spectral response in the bands used to calculate the vegetation indices. Thus, the images of the period that goes from the moment in which the crop completely covers the ground until flowering is the most advisable (Figure 4).
- During the campaign, the vegetation indices serve, mainly, to monitor the state of the crop and to decide on the management actions to be carried out. These actions can be diverse. Following the crop cycle (e.g., in extensive crops such as corn or winter cereals), one of the first actions to be carried out is the application of the cover fertilizer, mainly nitrogen (N). Remote sensing images are of great interest in this case, since N is one of the main costs in the production of these crops. The timing of image acquisition for this purpose is important. For example, in maize, the right time to acquire images is V6 (six leaves). At that time, the crop almost covers the ground and it is still possible to go inside to apply the fertilizer. After top dressing, crop monitoring is also important, particularly in irrigated crops. In these cases, the images are not only used to detect water stress and decide when to irrigate, but the vegetation indices can also be very useful to detect problems such as sprinkler failures, different water pressure along the arms of a pivot, nozzle failure, etc.
- Another important issue is crop yield prediction before harvest. Some vegetation indices calculated from images a few weeks before harvest tend to correlate well with yield (Figure 5), without the drawbacks of yield monitors, or without the need to wait until the end of the season to know how the final yield of the plot can be. Thus, vigor maps can be useful to organize logistics or to have a forecast of income from the sale of grain.
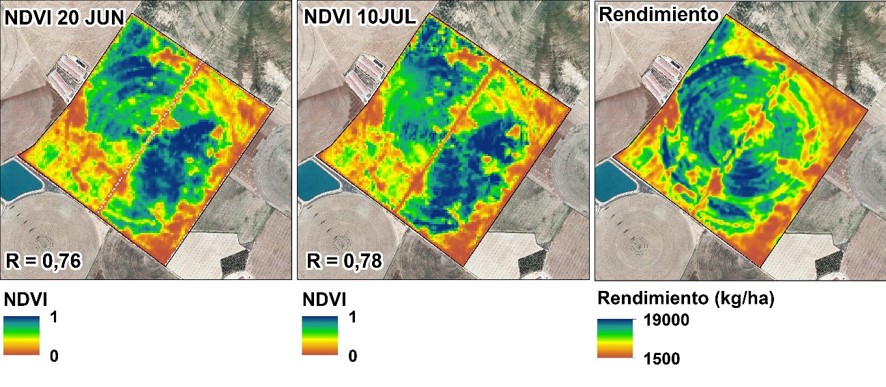
Figure 5. Comparison of maps of the normalized difference vegetation index (NDVI) of a corn plot on two dates and the corresponding yield map obtained from data from a harvest monitor at the end of the campaign. The correlation coefficient between the NDVI and Yield data is shown, with values of 0.76 and 0.78, respectively.
1.3.2. Dron applications
Research and development of unmanned aerial vehicles (UAVs or drones) and their applications in agriculture and other areas has increased remarkably in recent years. There are numerous examples in the scientific literature, ranging from obtaining maps of crop vigor to 3D reconstruction of the leaf architecture of fruit plantations. As an example, below are some in which the GRAP has worked.
One of them is the determination of the nutritional status (N) of maize through spectral indices and height data derived from drone images, in order to determine the amount of N required by the crop just before flowering (Maresma et al., 2016). This study was motivated by the increasing demand for commercial UAV services in agriculture and the need to adjust N fertilization rates applied to maize crops. Thus, the spectral response of different doses of inorganic N, organic N and combinations of organic-inorganic N in experimental plots (10 x 15 m) was analyzed using an image acquired by an Atmos-6 drone (CATUAV, Moià, Catalonia, Spain), and a VEGCAM-Pro camera with a 14 Mp Fove-on X3 image sensor that acquired data in three broad spectral bands (green, red and near infrared) (Figure 6).
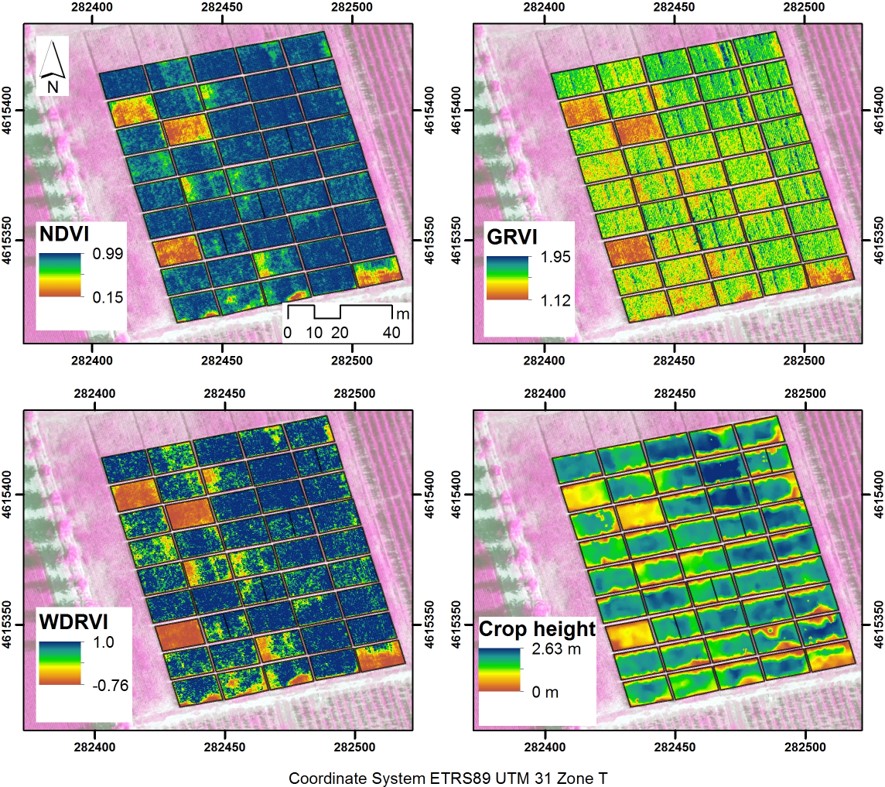
Figure 6. Vegetation and crop height indices obtained from multispectral images acquired from a drone in test plots of different amounts of organic and inorganic nitrogen in corn. Source: Maresma et al. (2016).
The results obtained showed that the Wide Dynamic Range Vegetation Index (WDRVI) was the best to distinguish between treatments with applications above or below 250-300 kg N/ha and in the prediction of grain yield in stage V12 (Maresma et al., 2016).
In relation to the previous example, one of the most common applications of Precision Agriculture techniques in extensive crops is variable fertilization. To understand the intrafield variability of crop vigor, farmers face the dilemma of which remote sensing data to use: satellite images or drone images. This decision depends on the size of the plots, but the increasing availability of commercial services based on drone imagery makes it attractive for farmers to use these services. Next, a case study developed in the GRAP on variable nitrogen fertilization in barley topdressing based on a drone image, in a 75 ha plot, is presented. Image acquisition was performed in March 2019 using a Sequoia camera (Parrot SA, Paris, France) mounted on a DJI Inspire 1-T600 UAV (DJI Sciences and Technologies Ltd., Shenzhen, China) (Figure 1). The pixel size of the acquired images was approximately 0.07 µm. A total of 2850 photos were acquired and a calibrated mosaic for the four spectral bands was created with the help of Pixel4D software. From here, the NDVI was calculated and classified into 3 classes with a k-means algorithm. The service and the cost/benefit for the farmer were evaluated considering a cost of 32 €/h for the acquisition and processing of data, a price of €200/Mg for the fertilizer and a price obtained for barley of 180 €/Mg. The average yield in each zone was: 4,300 kg/ha in the low vigor zone, 6,600 kg/ha in the medium vigor zone, and 8,900 kg/ha in the high vigor zone. Figure 7 shows the results of the NDVI map derived from the acquired multispectral image. Compared to the hypothetical gross profit obtained with the uniform fertilization, the variable fertilization based on the drone service generated gross profits of around 43 €/ha.
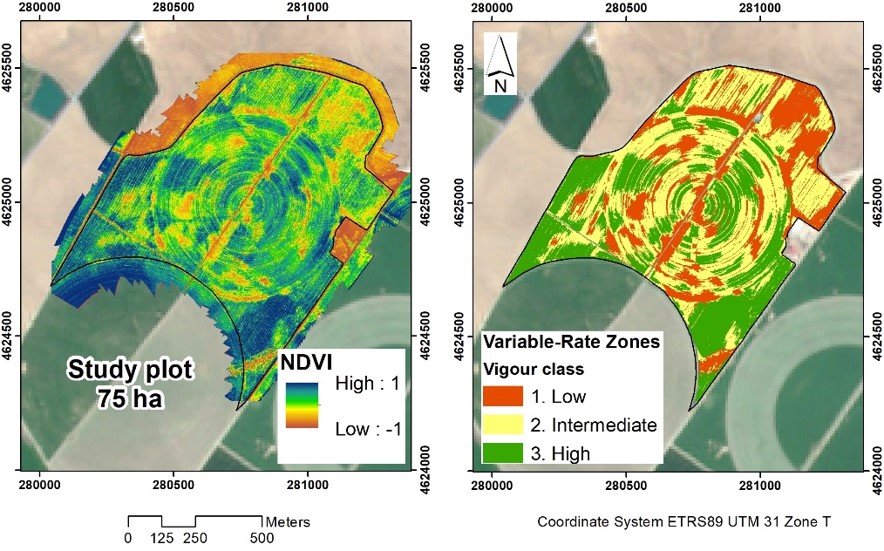
Figure 7. Left: NDVI derived from the multispectral image acquired in March 2019 to assess the stage of development of barley for variable rate topdressing. Right: zones of variable fertilization. Source: Jensen et al. (2021).
In a different approach, Martínez-Casasnovas et al. (2013) applied multi-temporal drone images to quantify the effects of erosion by ephemeral gullies in vineyard plots, as well as to evaluate the effects of erosion on the development of vines. For this, a fixed-wing Atmos-6 UAV equipped with a Sony NEX-C3-na camera was used. The 9 cm resolution images allowed the quantification of ephemeral gully volumes with high precision (Figure 8).
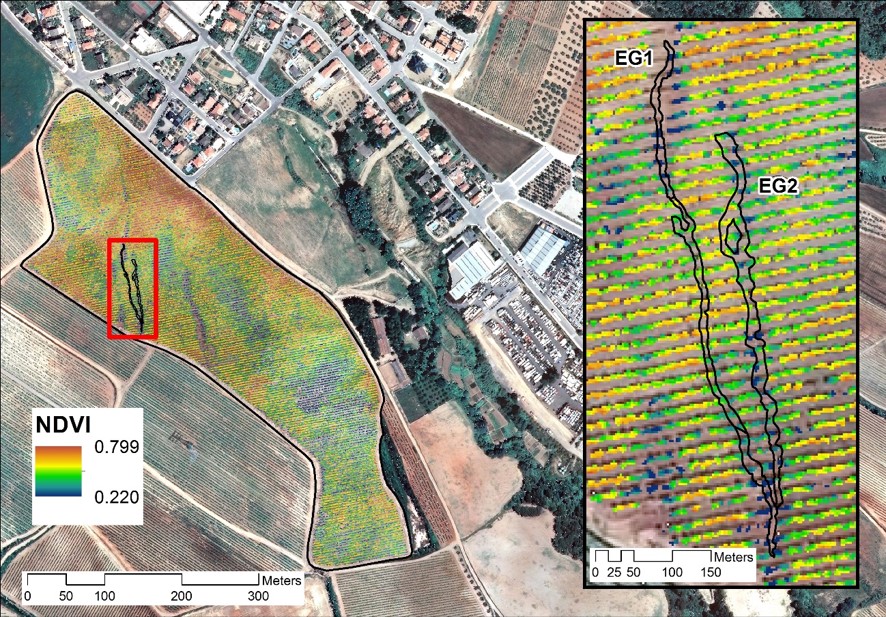
Figure 8. Vineyard plot located in els Hostalets de Pierola (Barcelona), where drone images were acquired with a resolution of 9 cm to quantify the erosion in the developed ephemeral gullies and its effect on the development of the vines. Source: Martínez-Casasnovas et al. (2013).
The results served to determine that the lack of implementation of soil and water conservation measures in the studied vineyard is causing significant rates of erosion by gullies and a progressive decrease in the level of the soil surface. This affects the development of the strains measured through the NDVI.
Another application of drone images, very different from the characterization of the vigor or development of crops, is the possibility of obtaining the 3D position of each pixel of the image thanks to the technique called Structure from motion. It is a low-cost and easy-to-use photogrammetric technique for obtaining high-resolution data at a range of scales, capable of representing a 2D to 3D object with just a few photographs from different points of view. Thus, with a minimum of 3 photographs taken from different points of view of an object and without knowing the exact position, these images can be reconstructed from 2D to 3D, which can be georeferenced during the process through known control points.
Figure 9 shows an example of the 3D reconstruction of an intensive plantation of almond trees arranged in a hedge using the Agisoft Metashape program (Agisoft LLC, St. Petesburg, Russia). From the digital surface model that is generated, it is possible to determine, in this case, geometric parameters of the plantation such as the width and height of each specified section along the rows, or the number of points acquired from a certain height (e.g. from the ground), which can be correlated with the leaf density in each section (Sandonís-Pozo et al., 2022).
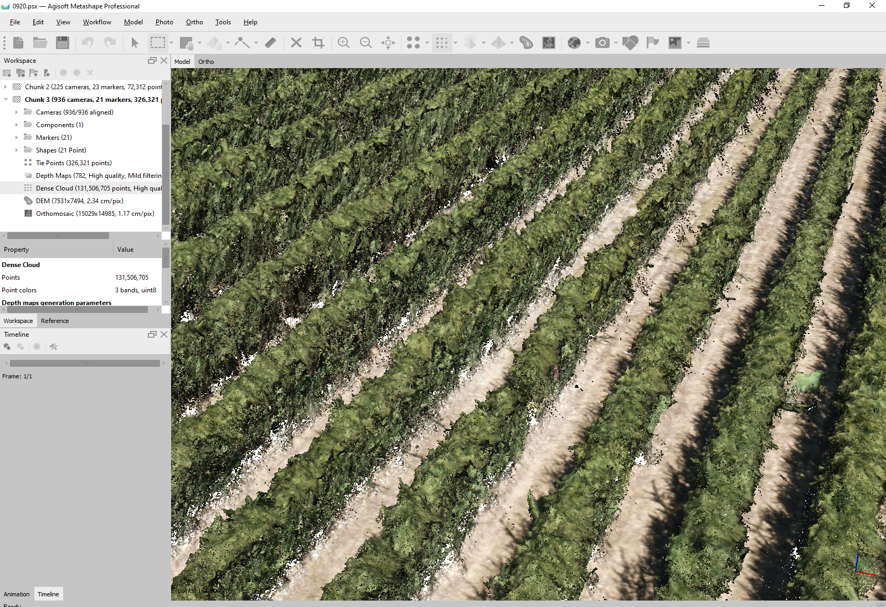
Figure 9. Screenshot of the Agisoft Metashape program with the reconstruction of an intensive almond plantation using the Structure from Motion technique. From the generated model, geometric parameters of the plantation can be calculated in each section, of interest in the management of the leaf canopy for Precision Agriculture.
Finally, highlight in this section of drone applications their use in the precision application of phytosanitary products (Figure 10). We present here an example of application with a drone from the company Ebredrone SL (Amposta, Catalonia, Spain) on a vineyard carried out within the framework of the PAgFRUIT research project (http://www.pagfruit.udl.cat), using an orthocopter capable of to transport up to 10 kg of liquid cargo or solid microgranules. The combination of speed and power means that an area of 4,000 to 6,000 m² can be covered in just 10 minutes. The intelligent spray system is capable of automatically adjusting the dose according to the flight speed to realize a uniform spray. The drone mounts four nozzles, placed directly below an engine. The airflow generated by the propellers speeds up the application, increasing its range (https://www.ebredrone.com). This type of equipment incorporates high-precision RTK positioning and navigation technology, which offers centimeter-precision positioning.
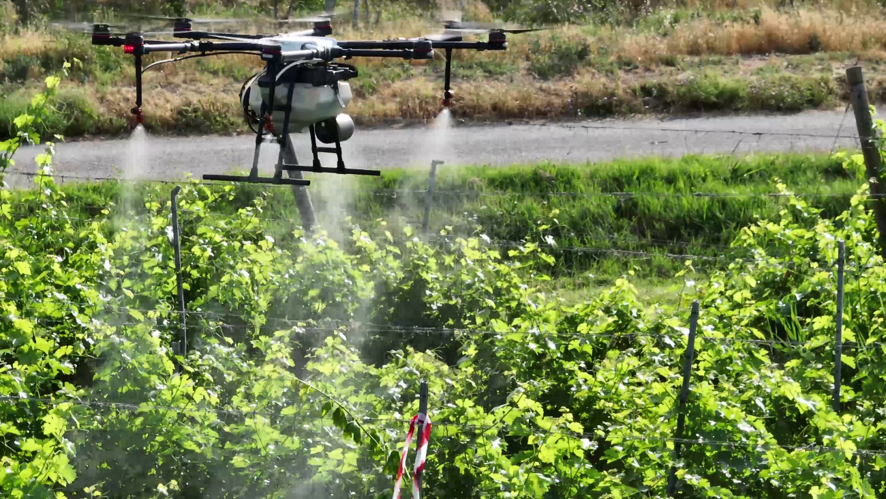
Figure 10. Example of application of phytosanitary products by drone in a vineyard. Application company Ebredrone SL (https://www.ebredrone.com), PAgFRUIT project (http://www.pagfruit.udl.cat).
To learn more about the applications of drones in Precision Agriculture, you can consult the book chapter “Unmanned Aerial Vehicles (UAVs) in Precision Agriculture”, by Ryan R. Jensen, Perry J. Hardin, Eduardo Galilea, José A. Martínez-Casasnovas and Austin Hopkins, published in “Sensing Approaches for Precision Agriculture” (Ed. R. Kerry & A. Escolà, Springer 2021, https://doi.org/10.1007/978-3-030-78431-7
1.3.3. Estimation of geometric and structural parameters of the canopy from vegetation index in fruit tree plantations
In fruit plantations, one of the main factors to consider when managing the crop is the vegetative state and/or the level of development of the leaf canopy. This is important at various times of the campaign in order to define actions such as the intensity of pruning, irrigation, fertilization and the application of phytosanitary products.
To determine the tree architecture of trees in plantations, terrestrial LiDAR is, without a doubt, perhaps the best option, not only because of the lateral "vision", but also because of the penetrability of laser beams, which allow determining impacts on inside the leaf canopy and determine parameters such as porosity.
In this line, the GRAP is studying the relationships between the geometric and structural parameters of intensive plantations of almond and olive trees with indices of vegetation indices derived from satellite images. The ultimate goal is to be able to extend the information measured with LiDAR to an entire plantation or farm, which is still difficult to characterize from LiDAR due to the volume of data to be processed. This may be of great interest to use the information obtained to support the decision of operations such as differential pruning or the application of phytosanitary products, among others; and to facilitate the delimitation of management zones within the parcels.
An example is the work of Sandonís-Pozo, et al., (in press) (Figure 11), where the relationship between geometric and structural parameters such as width, cross-section and porosity in relation to NDVI is analyzed, both with images of Sentinel-2 as from PlanetScope. These indices are then used to define areas with significant differences in these properties.
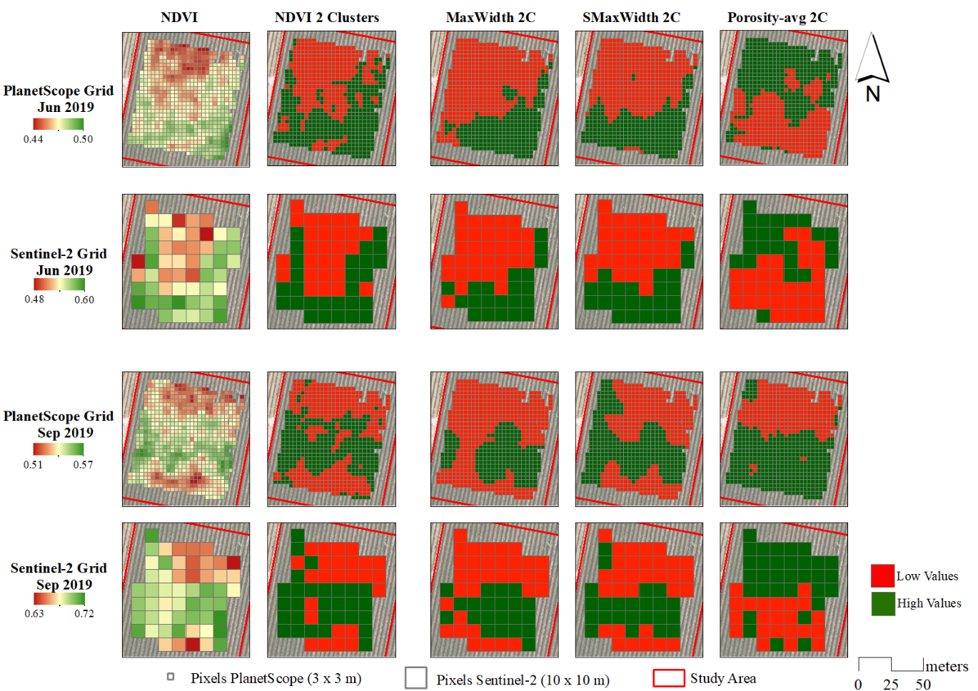
Figure 11. Relationship between NDVI derived from Sentinel-2 and PlanetScope images in an intensive almond plantation with the geometric parameters maximum width and cross section, and with the porosity of the leaf canopy. Source: Sandonís-Pozo et al. (in press).
Bibliographic references
Jensen, R.R., Perry, J., Galilea, E., Martínez-Casasnovas, J.A., Hpokins, A. 2021. Unmanned Aerial Vehicles (UAVs) in Precision Agriculture. In: R. Kerry & A. Escolà (eds.), Sensing Approaches for Precision Agriculture, Springer Nature, Cahm, Switzerland, pp 253-274, https://doi.org/10.1007/978-3-030-78431-7
Martínez-Casasnovas, J.A., Ramos, M.C., Balasch, C. 2013. Precision analysis of the effect of ephemeral gully erosion on vine vigour using NDVI images. In: J. Stafford (ed.), Precision Agriculture’13, Wageningen Academic Publishers, Wageningen (The Netherlands), pp 777-783.
Maresma, A., Ariza, M., Martínez, E., Lloveras, J., Martínez-Casasnovas, J.A. 2016. Analysis of Vegetation Indices to Determine Nitrogen Application and Yield Prediction in Maize (Zea mays L.) from a Standard UAV Service. Remote Sensing 2016, 8, 973; https://doi.org/10.3390/rs8120973
Martínez-Casasnovas, J.A., Escolà, A., Arnó, J. 2018. Use of Farmer Knowledge in the Delineation of Potential Management Zones in Precision Agriculture: A Case Study in Maize (Zea mays L.). Agriculture 2018, 8, 84; https://doi.org/10.3390/agriculture8060084
Sandonís-Pozo, L., Plata-Moreno, J.M., Llorens, J., Escolà, A., Pascual-Roca, M., Martínez-Casasnovas, J.A. 2022. PlanetScope Vegetation Indices to Estimate UAV and LiDAR-derived Canopy Parameters in a Super-Intensive Almond Orchard. In: FRUTIC 2022, June 29-July 1 2022, Valencia, Spain. 5 pp.
Sandonís-Pozo, L., Llorens, J., Escolà, A., Arnó, J., Pascual, M., Martínez-Casasnovas, J.A., en prensa. Satellite Multispectral Indices to Estimate Canopy Parameters and Within-Field Management Zones in Super-Intensive Almond Orchards. Precision Agriculture, Springer Nature.